

Website Reporting: How to Track and Improve Digital Performance
A business website can generate traffic, attract potential customers, and support marketing campaigns. However, without a clear way to measure results, it can be difficult to determine whether the website is performing as expected. Businesses need a structured method to review important metrics, identify trends, and understand which improvements deserve attention.
Website reporting helps turn website data into useful information. By organising performance metrics into clear reports, businesses can evaluate traffic, engagement, conversions, and technical performance without relying on assumptions.
Whether you run a small business website, an eCommerce store, or a corporate platform, an effective reporting process can help you make better digital decisions.
In this guide, we will explain website reporting, the metrics worth tracking, how to create useful reports, and how to turn reporting insights into practical improvements.
What Is Website Reporting?
Website reporting is the process of collecting, organising, analysing, and presenting information about a website’s performance. Reports help business owners, marketers, and development teams understand whether their website is meeting its objectives.
A website report may include information about visitor numbers, traffic sources, landing pages, conversions, search visibility, page speed, and user engagement.
For example, a digital agency may prepare a monthly report showing how much organic traffic its website receives, which service pages attract visitors, how many enquiries are generated, and which pages may need improvement.
The purpose of reporting is not simply to present numbers. It is to explain what those numbers mean and identify the next steps.
Why Is Website Reporting Important?
1. Measures Progress Towards Business Goals
Every website should have a purpose. It may be designed to generate leads, sell products, promote services, provide information, or encourage bookings.
Website reporting connects performance metrics with these objectives. Businesses can see whether their digital efforts are contributing to the outcomes they want to achieve.
2. Identifies Opportunities for Improvement
Reports can reveal pages with declining traffic, campaigns that attract visitors but few conversions, or forms that receive fewer completed submissions than expected.
These patterns help teams decide where to investigate. Additional testing and user feedback can then help identify the underlying issues.
3. Improves Marketing Decisions
Businesses often invest in search engine optimisation, paid advertising, email marketing, and social media. Reporting helps compare the performance of these channels using relevant measurements.
For example, a campaign that generates a large volume of traffic may not necessarily generate the most qualified leads. Reporting helps businesses consider both traffic volume and business outcomes.
4. Supports Better Communication
A well-organised report makes it easier for business owners, marketers, and developers to understand what is happening on a website.
Instead of sharing disconnected statistics, teams can discuss results, explain challenges, and agree on specific actions.
5. Helps Monitor Website Health
Website performance is not limited to marketing metrics. Reports can also include uptime, page speed, broken links, indexing concerns, and other technical indicators.
Regular monitoring helps teams identify issues before they significantly affect the visitor experience.
Key Metrics to Include in a Website Report
The metrics you choose should depend on your business model and website objectives. Avoid filling reports with measurements that do not support a meaningful decision.
1. Website Traffic
Website traffic reports show how visitors reach and interact with a website.
Useful measurements include users, sessions, page views, and traffic channels. These metrics help identify overall trends and changes in audience activity.
However, increasing traffic does not automatically mean the website is performing better. The relevance of visitors and the actions they complete are equally important.
2. Traffic Acquisition
Traffic acquisition reporting helps businesses understand which channels bring visitors to their websites.
Common channels include:
- Organic search.
- Paid search.
- Direct traffic.
- Referral traffic.
- Social media.
- Email marketing.
Comparing channels can help businesses decide where to investigate opportunities and how to allocate their marketing resources.
3. Landing Page Performance
Landing pages are the pages visitors enter first during a website session. These may include blog articles, product pages, service pages, or the homepage.
A landing page report can show which pages attract visitors and whether those visitors take meaningful actions.
If a page receives substantial traffic but few enquiries, review the relevance of the content, the clarity of the call to action, and the ease of navigating to the next step.
4. Conversion Rate
Conversion reporting measures how effectively a website encourages visitors to complete desired actions.
Depending on the website, conversions may include purchases, enquiry submissions, bookings, registrations, or newsletter sign-ups.
A basic session-based conversion rate can be calculated as:
Conversion rate = (Sessions with a conversion ÷ Total sessions) × 100
For example, if a website records 40 sessions with a completed enquiry form out of 2,000 sessions, the session-based conversion rate is 2%.
Make sure your conversion definition and tracking configuration remain consistent when comparing reports.
5. Search Performance
Search reporting helps businesses understand how their website appears in Google Search.
Important Search Console metrics include impressions, clicks, click-through rate, and average position. These can help identify pages and queries that deserve further investigation.
Search visibility data should be considered alongside website engagement and conversion data. Search impressions or clicks alone do not establish whether a page is generating business value.
6. Website Speed and Technical Performance
Technical reporting helps identify potential barriers to a good user experience.
Useful checks include loading performance, mobile usability, broken links, indexing issues, and relevant Core Web Vitals.
Use Google PageSpeed Insights to review page performance and explore possible improvements.
7. Leads and Revenue
For lead-generation websites, track completed enquiries and, where possible, qualified leads and resulting customers.
For eCommerce websites, useful measurements include purchases, revenue, average order value, and checkout completion.
Connecting website reporting with CRM or sales data can provide a better understanding of the relationship between online activity and actual business results.
Best Tools for Website Reporting
The best reporting setup depends on your objectives, website platform, and technical requirements.
Google Analytics 4
Google Analytics 4 helps businesses report on website activity, acquisition channels, engagement, and configured conversions.
Businesses can use it to review traffic trends, compare landing pages, and understand which tracked actions visitors complete.
For reliable reporting, configure events carefully and regularly check that important conversions are recorded accurately.
Google Search Console
Google Search Console provides information about a website’s performance in Google Search, including search queries, clicks, impressions, and indexing-related issues.
It is particularly useful for reporting on organic search visibility and identifying pages that may need further SEO investigation.
Google Looker Studio
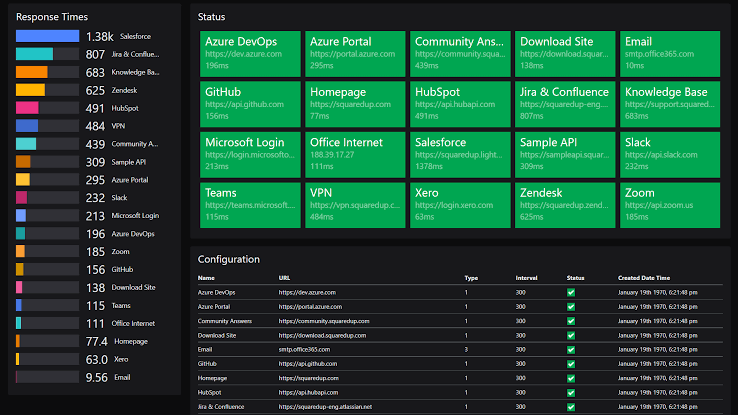
Google Looker Studio helps users create dashboards and visual reports from supported data sources.
Businesses can use dashboards to present key metrics in a consistent format, making it easier to share performance information with stakeholders.
Before relying on a dashboard, verify that its data sources, filters, date ranges, and calculations are correct.
Google PageSpeed Insights
PageSpeed Insights helps businesses evaluate page speed and selected user-experience performance indicators. It can support technical reporting by identifying opportunities to improve loading, responsiveness, and visual stability.
Spreadsheet Tools
Spreadsheets can be useful for small businesses that need simple monthly reporting. They allow teams to organise data, compare periods, document findings, and track action items.
However, manually maintained reports should include clear data sources and calculation rules to reduce errors.
How to Create an Effective Website Report
Step 1: Define the Purpose of the Report
Before collecting data, decide what the report needs to answer.
A business owner may want to know whether the website generates enough qualified enquiries. An SEO specialist may focus on search visibility and organic landing pages. A developer may be more concerned with performance issues and technical errors.
The report should match its audience and purpose.
Step 2: Select Relevant KPIs
Choose a manageable set of key performance indicators.
For a service-based website, these might include organic sessions, completed enquiries, conversion rate, qualified leads, and page performance.
For an online store, the priorities may include product page activity, add-to-cart events, purchases, revenue, and checkout completion.
Do not include a metric simply because a reporting tool makes it available. Every metric should have a clear reason for being included.
Step 3: Choose a Reporting Period
Decide whether the report should cover a week, month, quarter, or another period.
Monthly reporting is useful for reviewing broader patterns, while weekly monitoring can help teams identify sudden changes.
Compare similar periods where possible. For example, comparing the same month across different years may help account for seasonal differences in some businesses.
Step 4: Collect Data from Reliable Sources
Use the appropriate tools for each type of measurement.
Google Analytics 4 can provide website activity data, Search Console can provide search performance information, and PageSpeed Insights can support technical performance reviews.
Record the data source, reporting period, and relevant definitions so that results can be understood and reproduced.
Step 5: Present the Findings Clearly
Use simple charts, tables, and concise explanations. Highlight important changes rather than presenting every available statistic.
For each major result, explain what changed and why it matters to the business.
For example, rather than reporting only that organic sessions declined, note which pages or search channels changed and what additional checks are needed to understand the decline.
Step 6: Recommend Specific Actions
A useful website report should lead to decisions.
If a service page receives relevant traffic but few enquiries, review its content and conversion path. If mobile conversion performance differs significantly from desktop, investigate the mobile experience. If search impressions increase while clicks remain flat, review relevant queries and search-result presentation.
Treat these observations as starting points for investigation rather than proof of a particular cause.
Step 7: Review Previous Actions
At the next reporting period, check whether earlier recommendations were implemented and what happened afterwards.
Document the change, the expected outcome, the metric being monitored, and the observed result.
This creates a continuous improvement process rather than a reporting routine that ends when the document is shared.
Website Reporting Best Practices
Keep Reports Focused
A short, relevant report is often more useful than a lengthy dashboard filled with unrelated statistics.
Prioritise the metrics that support decisions and move secondary details into an appendix or supporting dashboard.
Explain the Context Behind Changes
Traffic can change because of seasonality, marketing campaigns, search demand, website updates, or tracking problems.
Include enough context to help readers interpret results accurately. Avoid attributing a change to one factor without supporting evidence.
Use Consistent Definitions
Make sure metrics are calculated and interpreted consistently between reporting periods.
For example, a conversion rate based on sessions is not necessarily comparable with one based on users. Similarly, changing the definition of a qualified lead can affect the interpretation of results.
Protect Data Privacy
Only collect information needed for legitimate measurement purposes. Apply appropriate access controls, respect consent requirements, and follow relevant privacy laws and platform policies.
Avoid including sensitive personal information in reports or sending it to analytics tools.
Turn Reporting into an Ongoing Process
Website reporting is most useful when findings lead to action. Set a regular review schedule, assign responsibility for recommendations, and track whether the changes produce the intended results.
Common Website Reporting Mistakes to Avoid
Reporting Without Clear Goals
If the report does not relate to business objectives, it can become a collection of numbers without a clear purpose. Define the questions the report needs to answer before selecting metrics.
Focusing Only on Positive Results
Reporting should include challenges and unexpected changes as well as successes. Honest reporting helps teams identify issues and respond appropriately.
Ignoring Data Quality
Incorrect tracking, duplicate events, missing data, and inconsistent date ranges can lead to misleading conclusions. Validate data before presenting important results.
Making Decisions from Small Changes
Small fluctuations may be caused by normal variation. Consider traffic volume, the length of the reporting period, and other relevant factors before changing your strategy.
Failing to Follow Up
A report has limited value if no one acts on its recommendations. Assign action owners and revisit progress during the next review.
Website Reporting Checklist
Use this checklist when preparing your next performance report:
- Define the purpose and audience of the report.
- Select KPIs that match business objectives.
- Confirm the reporting period and data sources.
- Check analytics and conversion tracking accuracy.
- Review traffic acquisition and landing page performance.
- Measure relevant conversions, leads, or revenue.
- Check search visibility and technical performance where relevant.
- Explain significant changes with appropriate context.
- Recommend practical, prioritised actions.
- Review previous actions in the next reporting cycle.
- Follow privacy, consent, and data-handling requirements.
Conclusion
Website reporting helps businesses understand whether their digital activities are delivering meaningful results. By measuring relevant KPIs, reviewing reliable data, and explaining performance changes clearly, organisations can make more informed decisions about their websites and marketing strategies.
An effective reporting process goes beyond displaying charts. It connects website data with business goals, identifies opportunities for improvement, and creates a clear plan for action.
Whether your objective is to generate more qualified leads, improve eCommerce results, or strengthen organic search performance, consistent website reporting can help you monitor progress and prioritise the right improvements.
Looking to improve your website’s digital performance? Visit HiveRift to explore website development, user experience, SEO, and website optimisation services for modern businesses.
Frequently Asked Questions
1. What is website reporting?
Website reporting is the process of collecting, analysing, and presenting website performance data to help businesses understand traffic, engagement, conversions, and technical performance.
2. How often should I create a website report?
Many businesses prepare monthly reports to review broader performance trends and use weekly monitoring for important campaigns or technical issues. The ideal frequency depends on your website’s goals and activity levels.
3. Which metrics should a website report include?
Common metrics include users, sessions, traffic sources, landing page performance, conversion rate, search visibility, page speed, leads, and revenue. Choose the metrics that align with your business objectives.
4. What is the difference between website analytics and website reporting?
Website analytics focuses on collecting and analysing website data to understand behaviour and performance. Website reporting organises and communicates relevant findings so people can review results and make decisions.
5. Which tool is best for website reporting?
Google Analytics 4 is useful for website activity and configured conversions, Google Search Console supports search performance reporting, and Looker Studio can help present data in dashboards. The best combination depends on your reporting requirements.
6. Can website reporting improve business results?
Website reporting can help identify opportunities and guide improvements, but results depend on the quality of the data, the decisions made, and how effectively changes are implemented and evaluated.